The Alarm Details section provides information about the alarm and enables further investigative actions.
1 Alarm Details
Alarm details panel is accessible from any of the Alarm List view available from Alarm, Triage and Incident dashboards. Click on an alarm row in Alarm List, or on the Open Details button under the Action column (Alarm dashbord only), to access it.
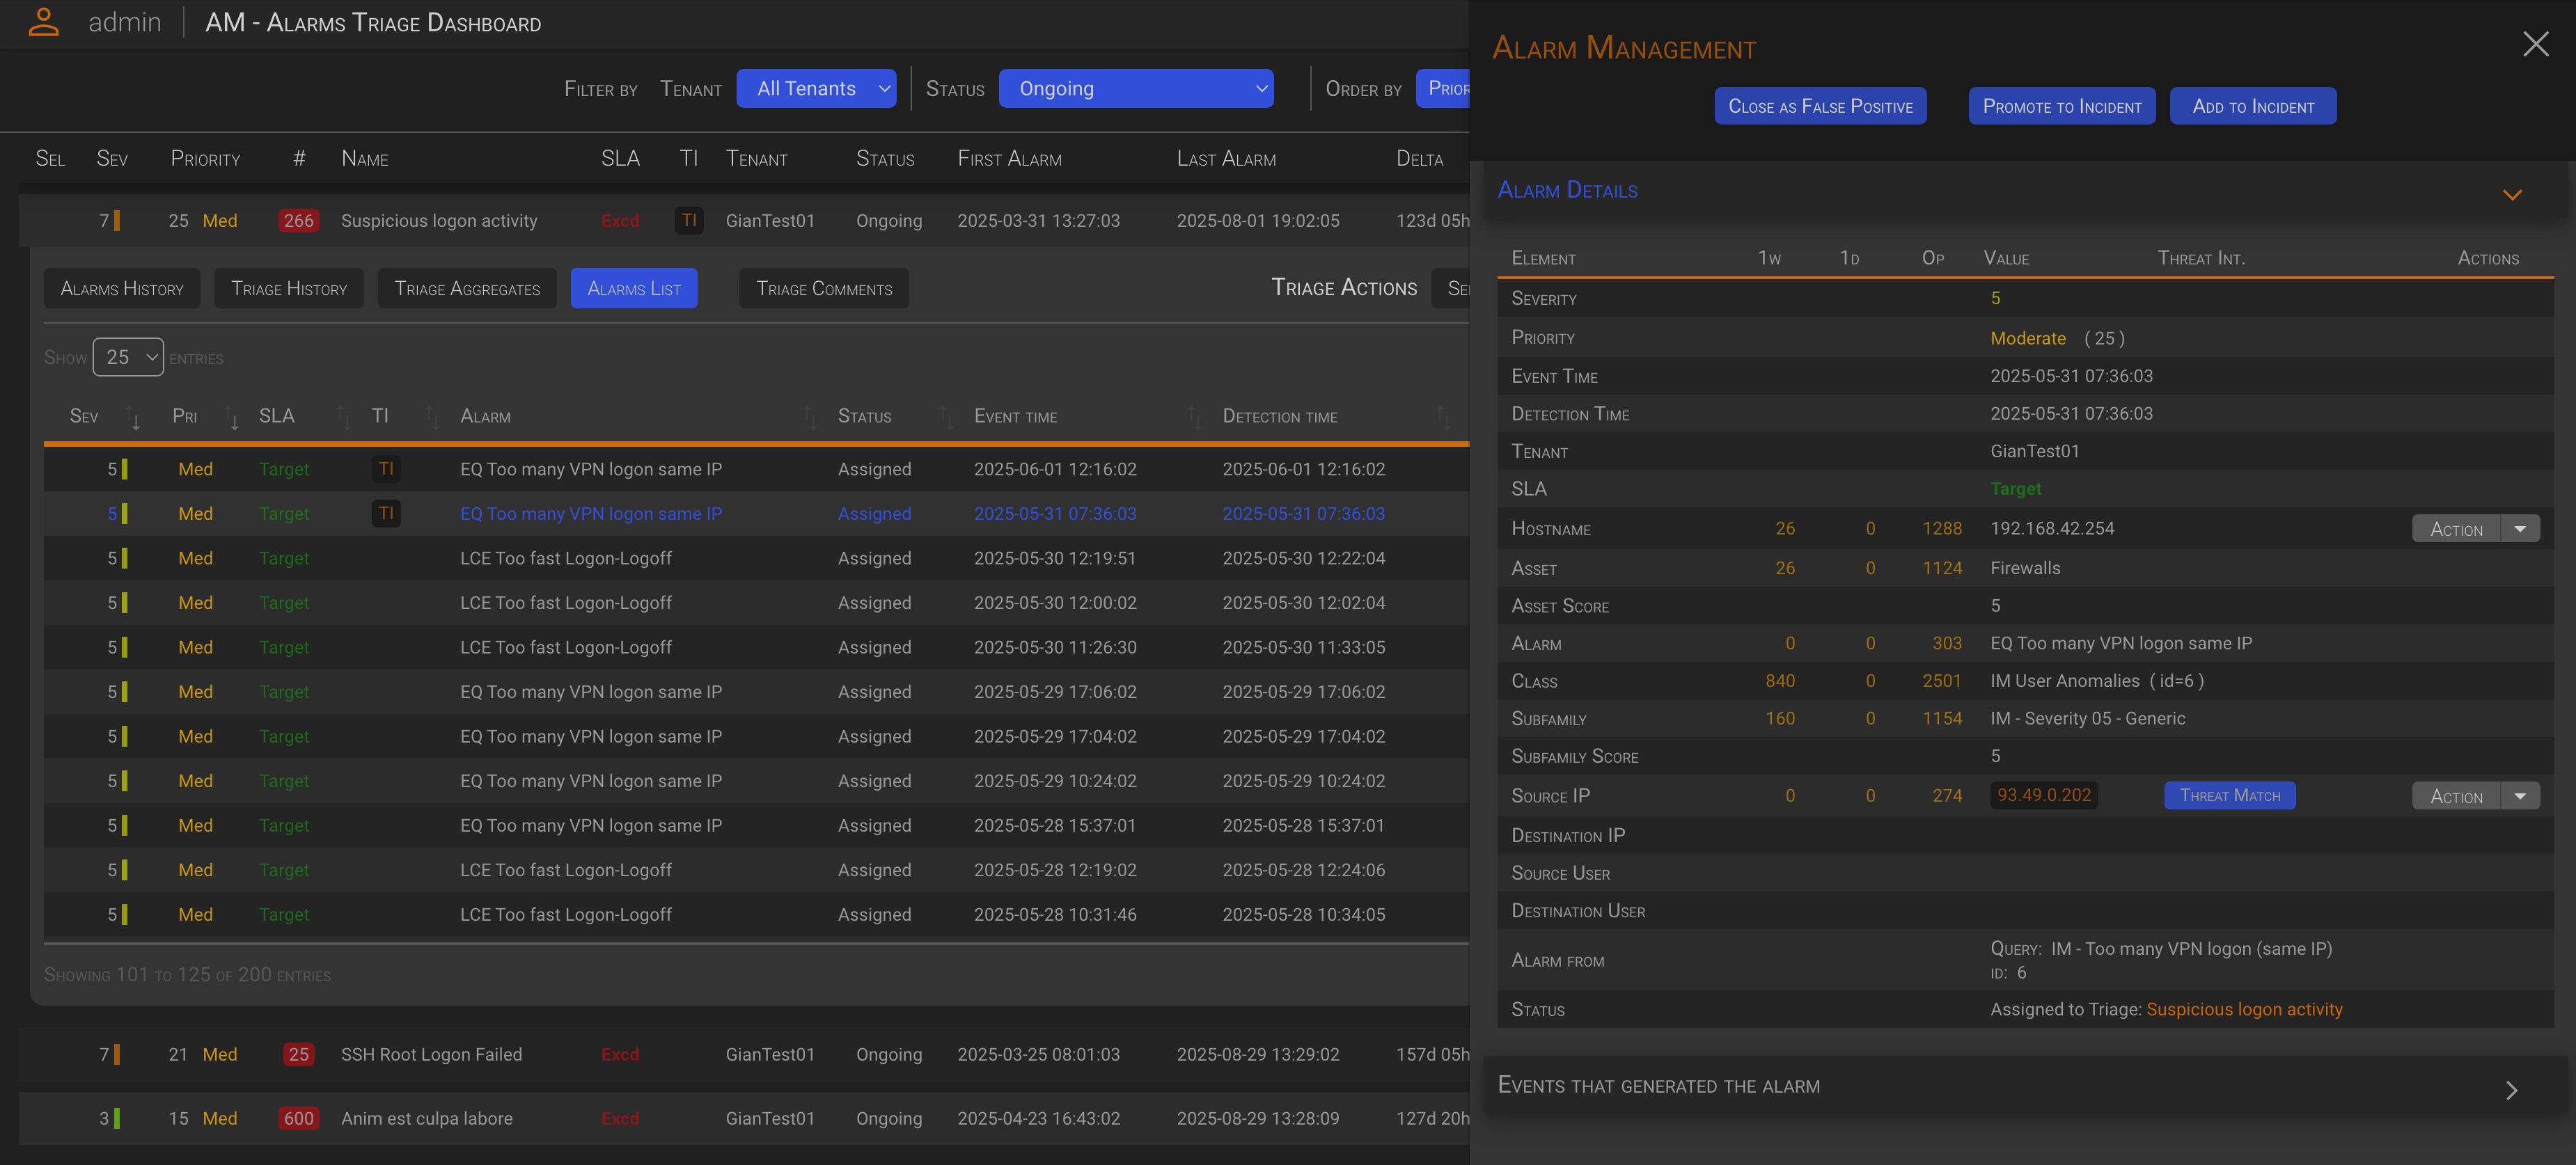
Now, let’s take a closer look at the alarm details panel.
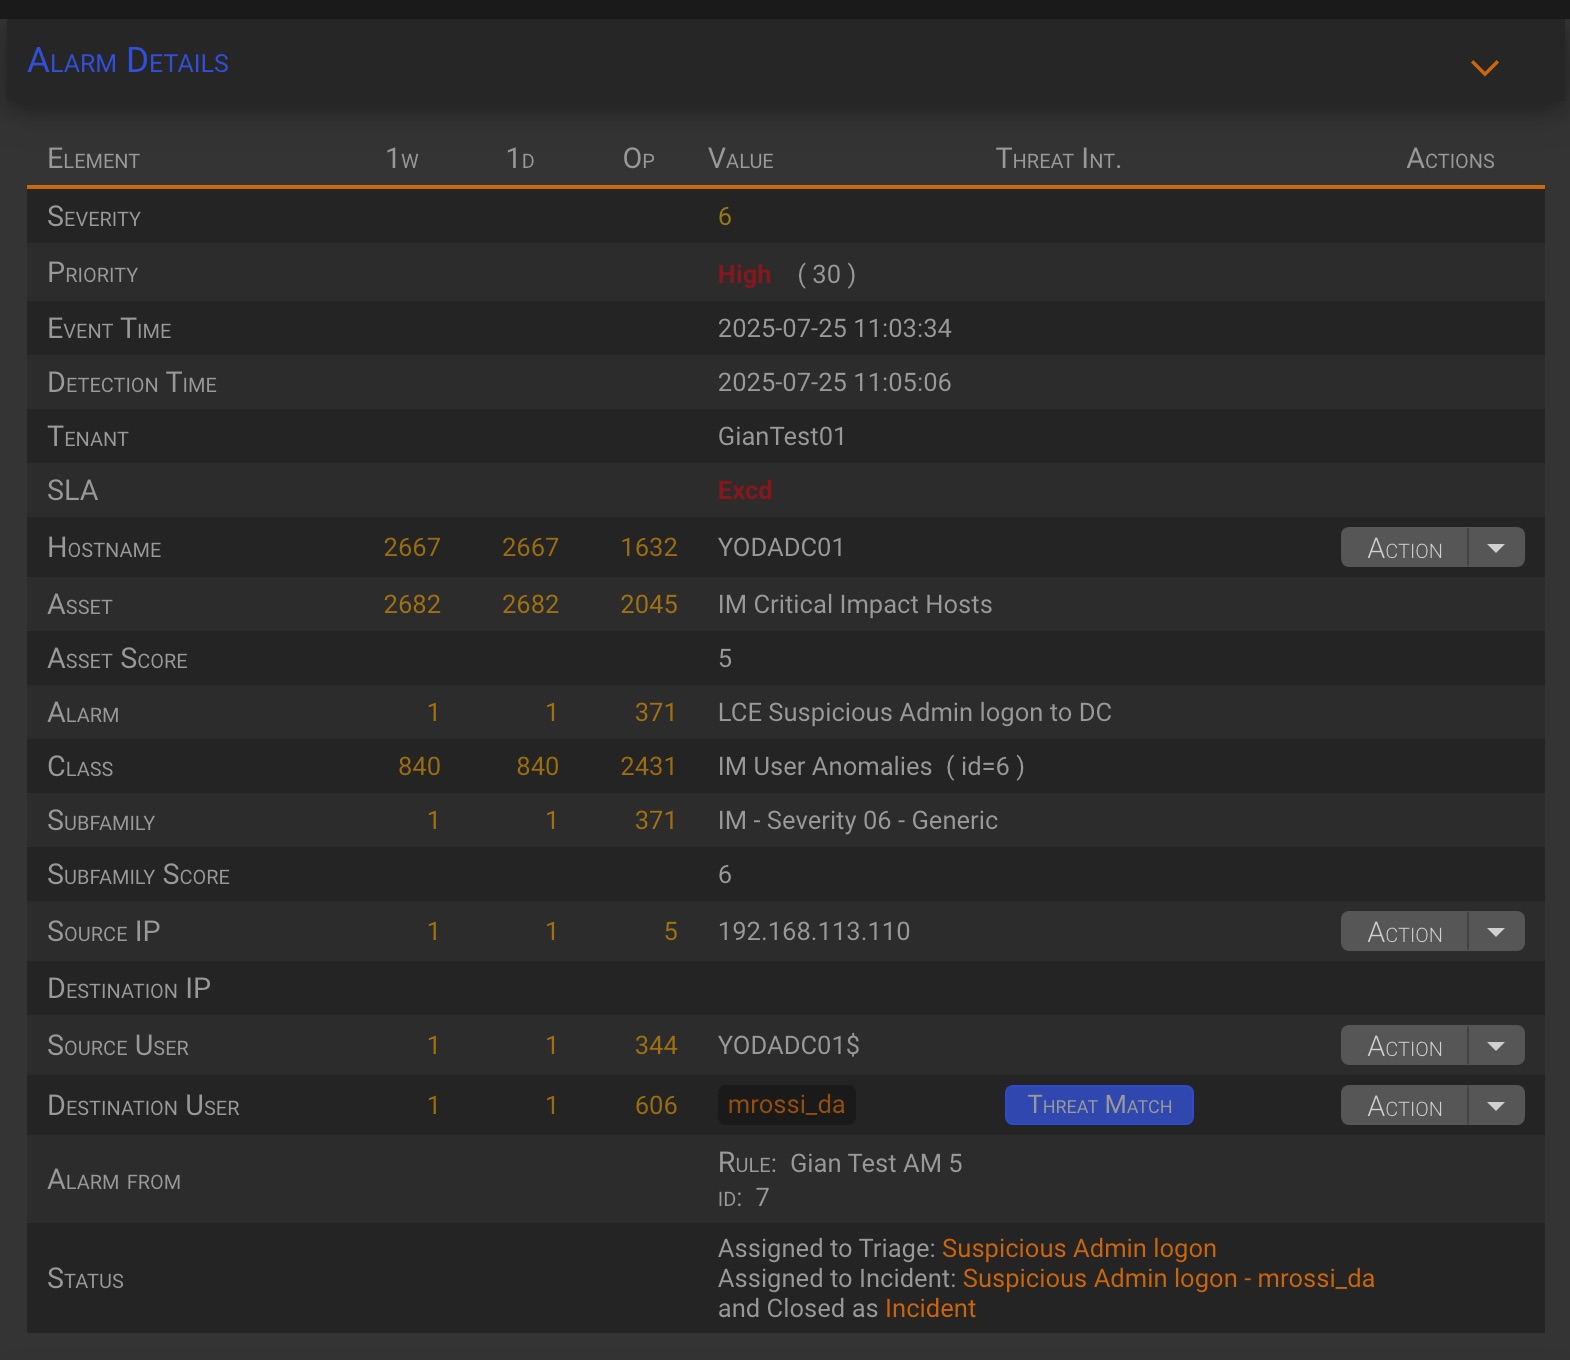
| Column | Description |
|---|---|
| Element | Element/paramenter name |
| 1w | The number of times the current alarm parameter was found in the last week closed alarms |
| 1d | The number of times the current alarm parameter was found in the last day closed alarms |
| Op | The number of times the current alarm parameter was found in the opened or assigned, but not yet closed, alarms |
| Value | The current element/parameter value |
| Threat Int. | A Threat Match button is displayed when a parameter matches one or more of the defined threat intelligence lists. |
| Actions | The action dropdown menu for the current element/parameter |
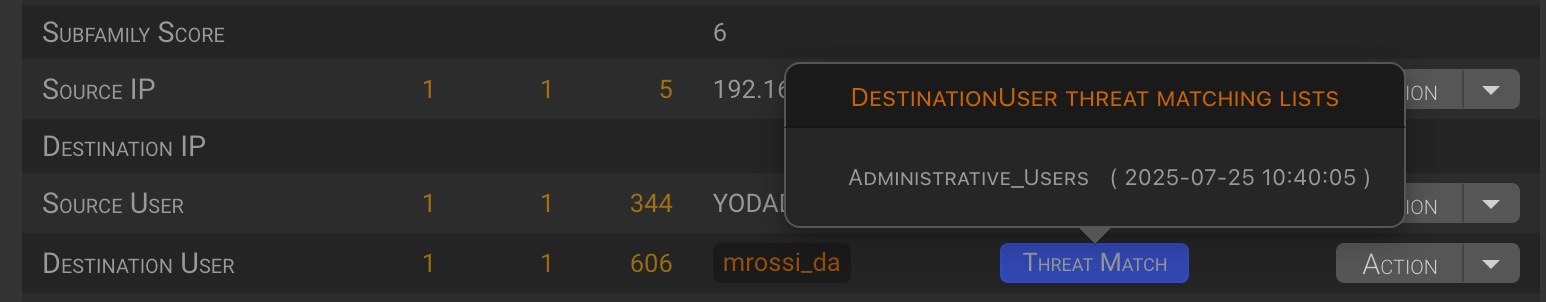
1.1 Threat Intelligence match
When the Threat Intelligence is enabled (see Threat Intelligence Configuration), any of the alarm’s standard parameters value found in a configured Threat Intalligence list are highlighted. Hovering on the Threat Match button will display a pop-up containing the lists in which the parameter was found and the list last update date.
1.2 Action dropdown menu
The Action drop-down menu allows you to perform actions with the corresponding parameter value as input.
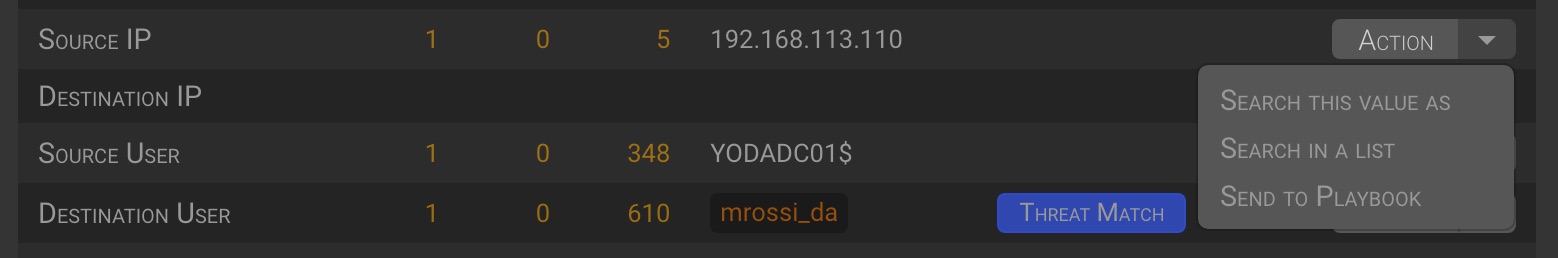
Let’s see actions in detail. The following actions are available:
- Search this value as
- Search in a list
- Send to Playbook
1.2.1 Search this value as
This action allow to search and display all events having the selected parameter value as one on the predefined parameter Category/Subcategory, within the specified time range.
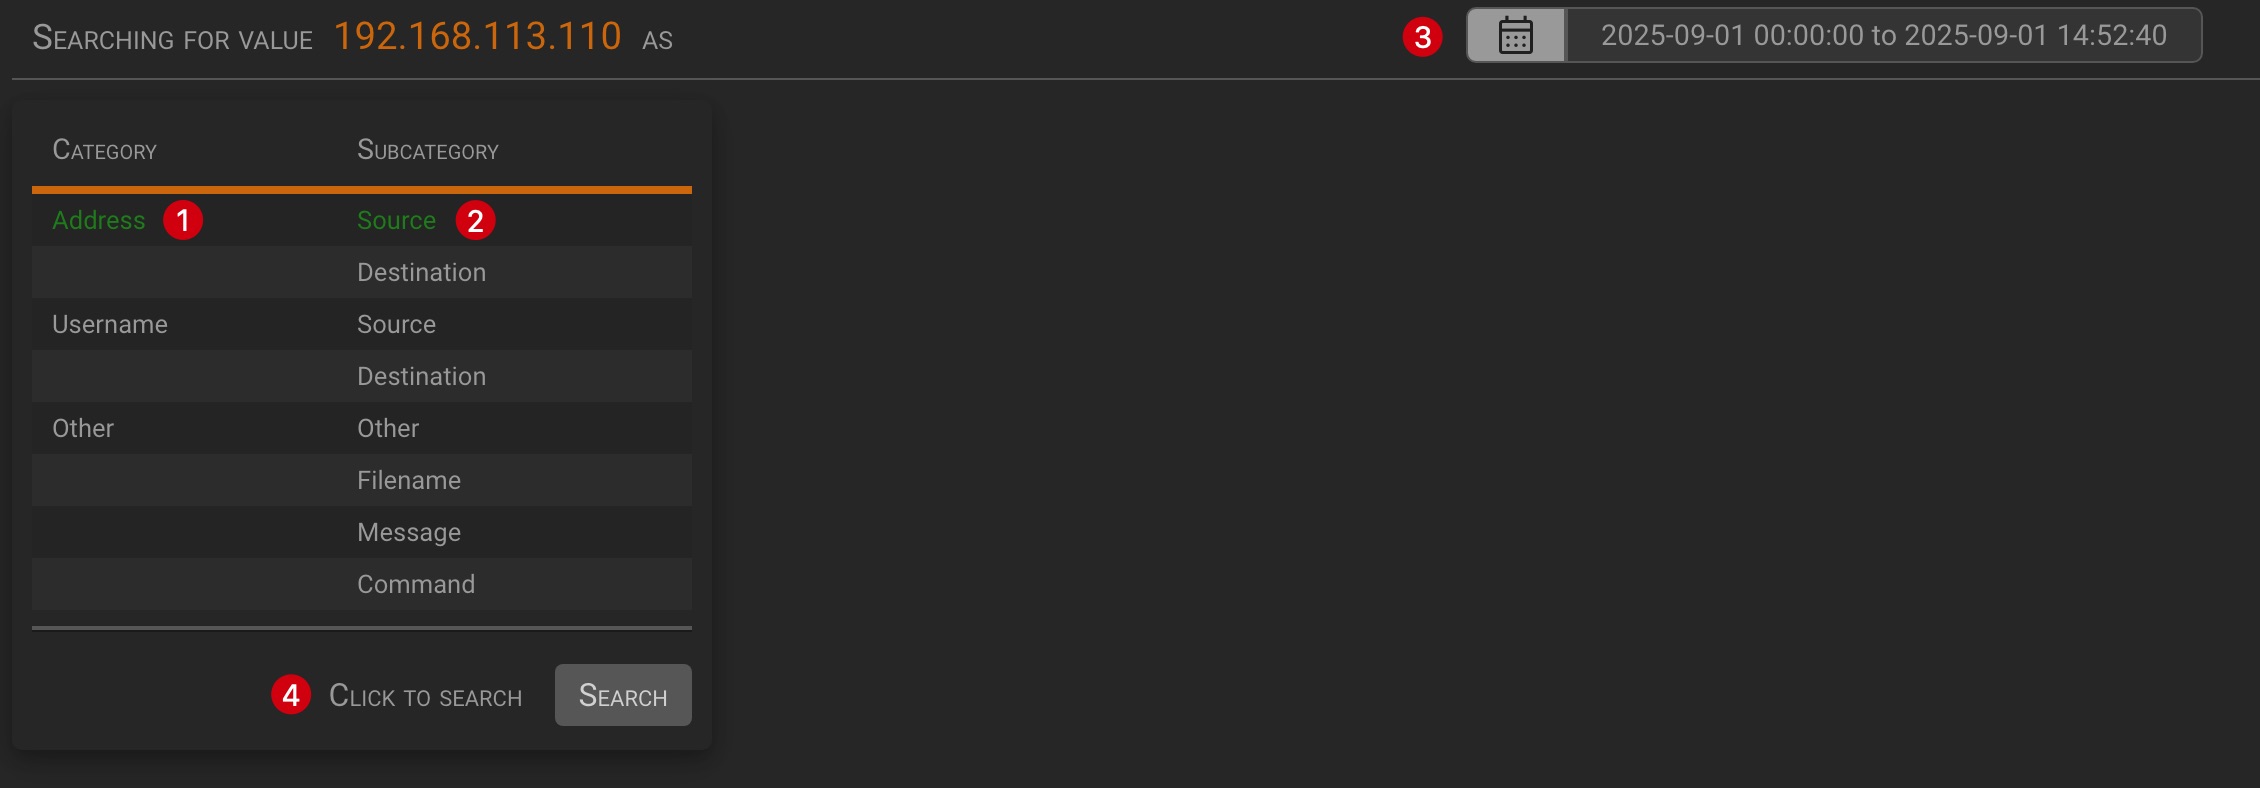
The panel will display the Category/Subcategory selection table. Select the Category or Subcategory you want to search by clicking on its name (1)(2), then click the Search button to start the search.
TIP
Selecting only a category is equivalent to selecting the category and all of its subcategories.
In the example we are searching all events, beyond the current one, having a parameter categorized as Address/Source. By default, the Event List view is displayed.
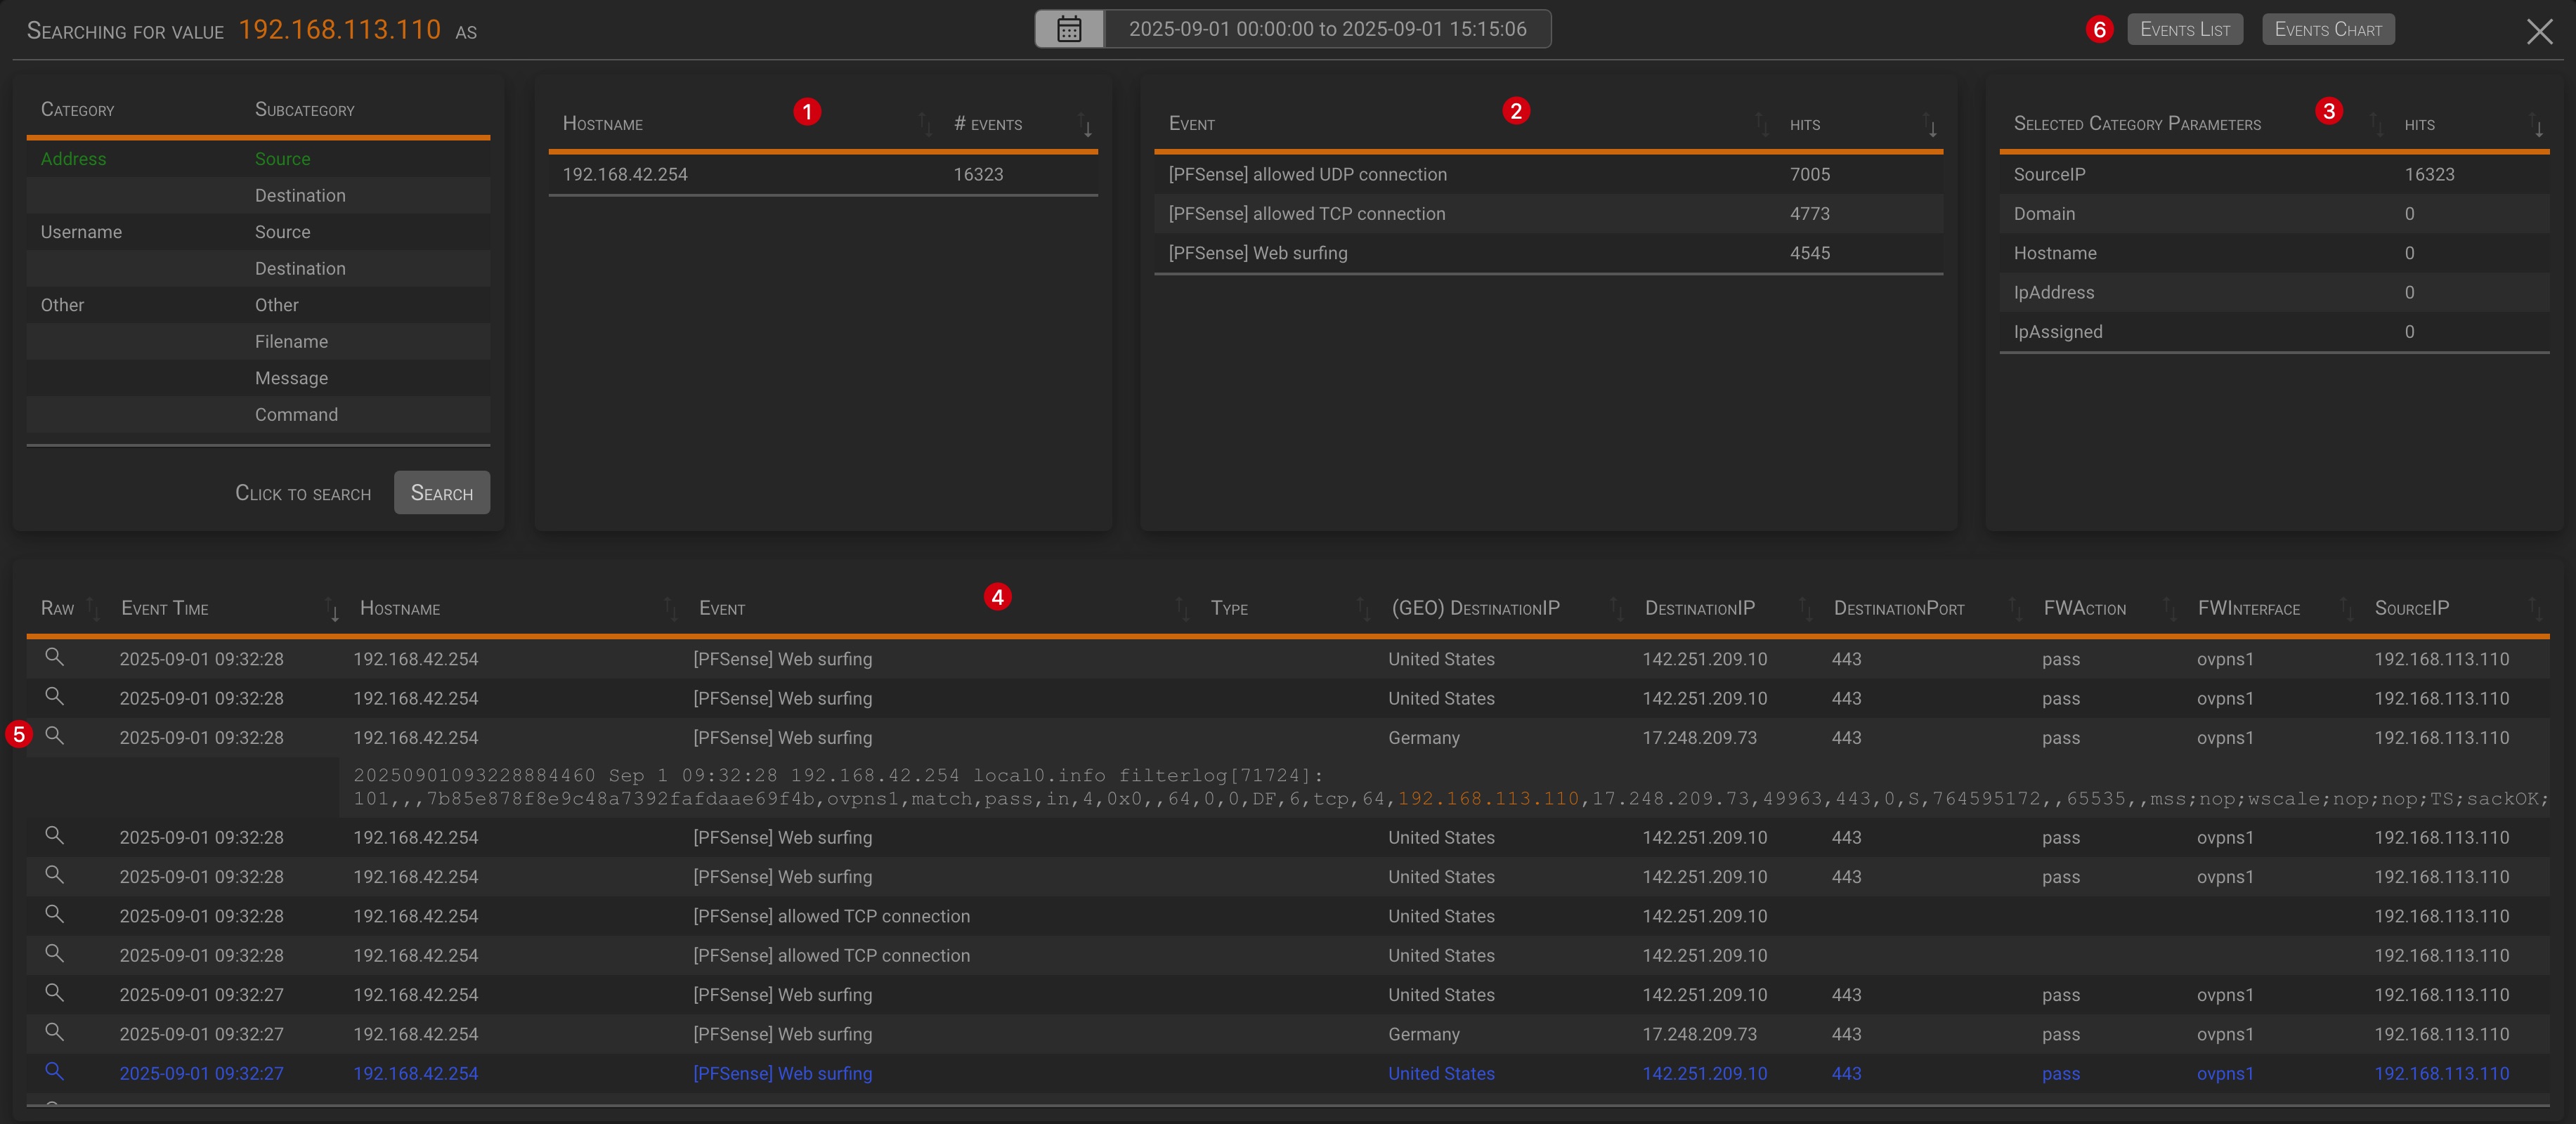
Beyond the category/subcategory selection table, the panel contains four additional sections:
(1) The list of matching event hostnames aggregated by host; (2) The list of matching events aggregated by host; (3) The list of events parameters that match the search value aggregated by parameter; (4) The events list whose parameters match the search value;
TIP
- The detail view can be filtered by selecting one or more values from the aggregated view
- Clicking the magnifying glass icon (5) will toggle the display of the event-related raw log.
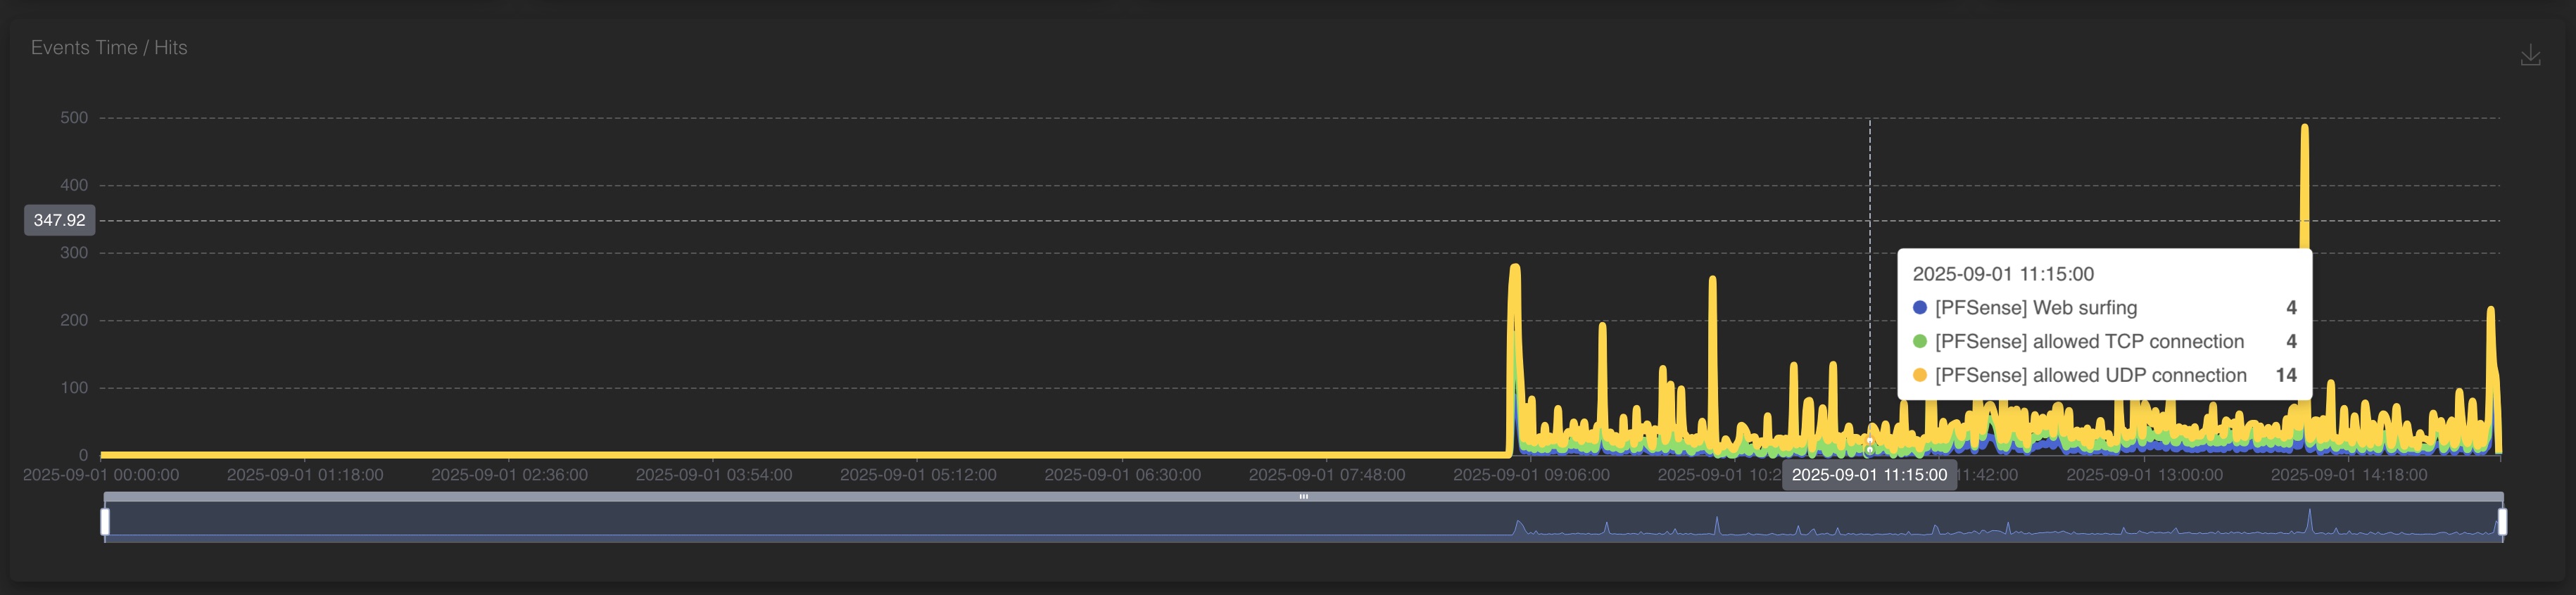
Clicking the Event Chart button (6) will switch the event list to the event chart, and viceversa.
1.2.2 Search in a list
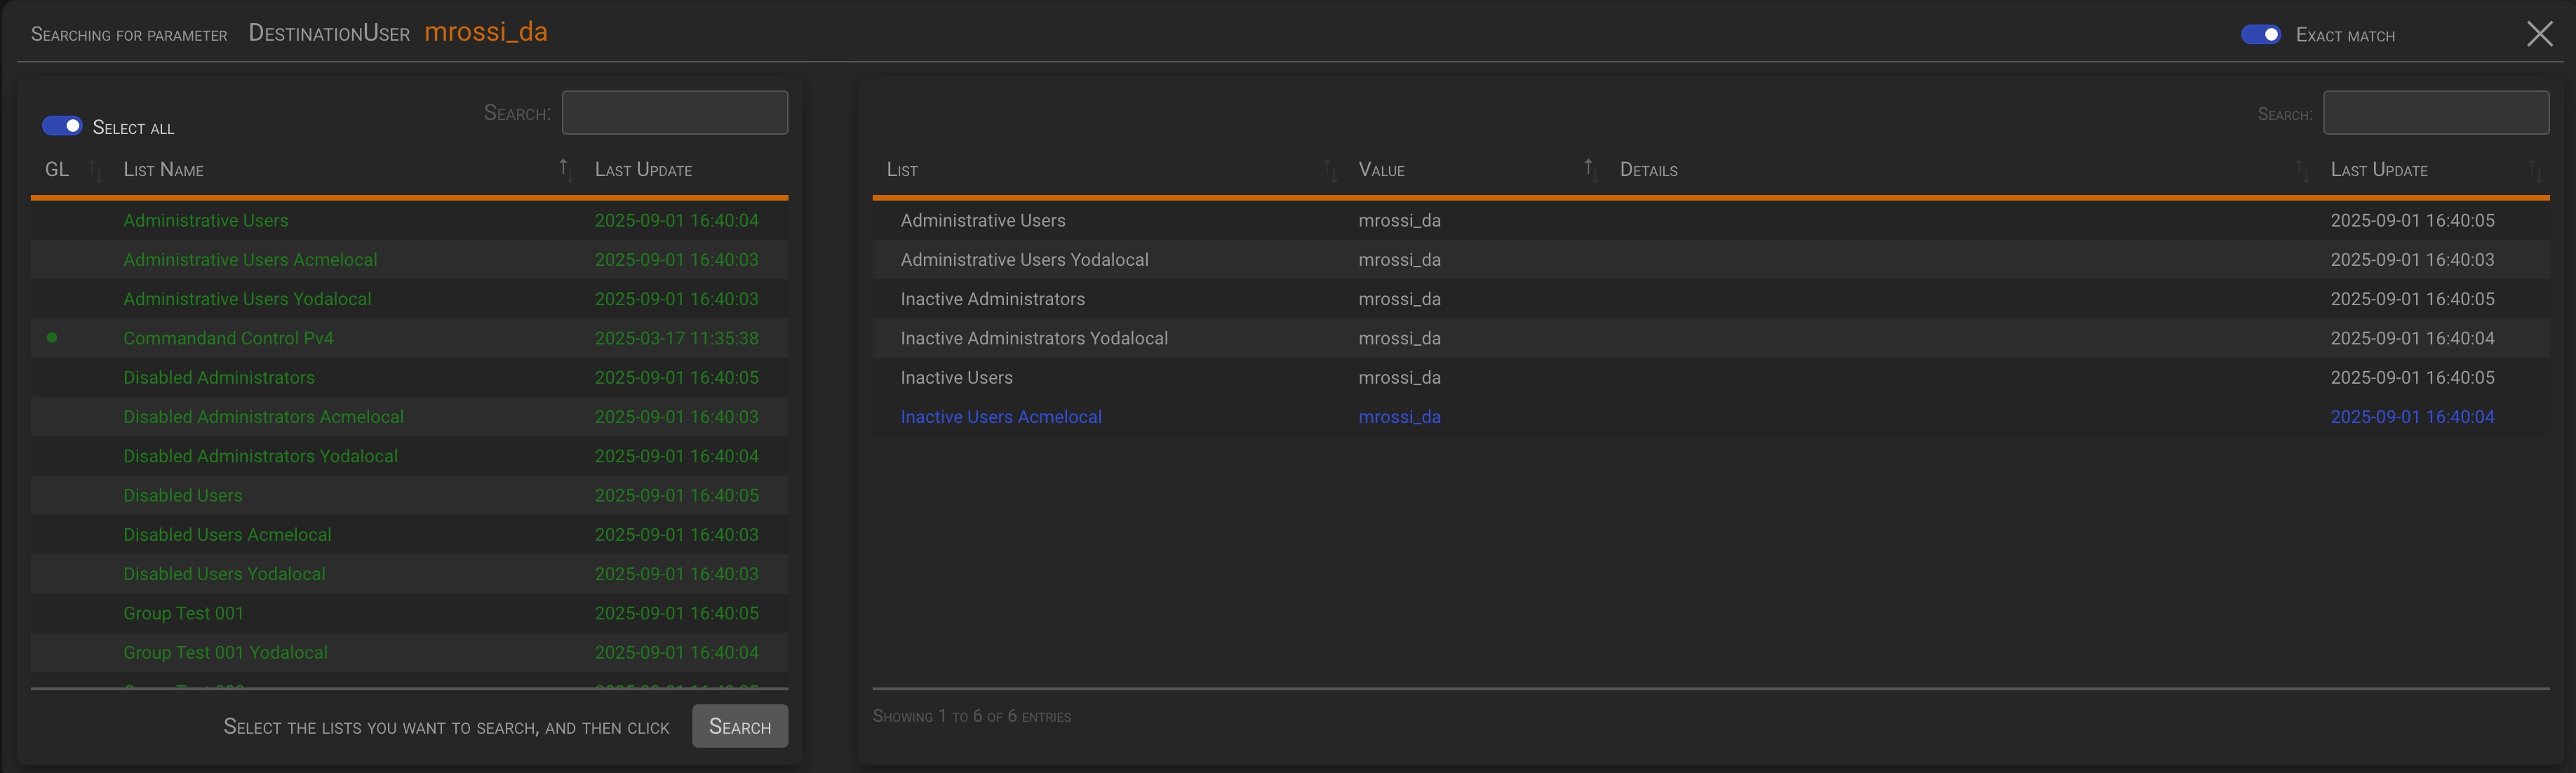
This action allows you to search which of the Threat Intelligence or other lists the searched parameter value was found in.
TIP
When operating from the Manager Instance, a green dot in the GL column means that the list is globally defined on the Manager. Other lists are related to the tenant’s alarm.
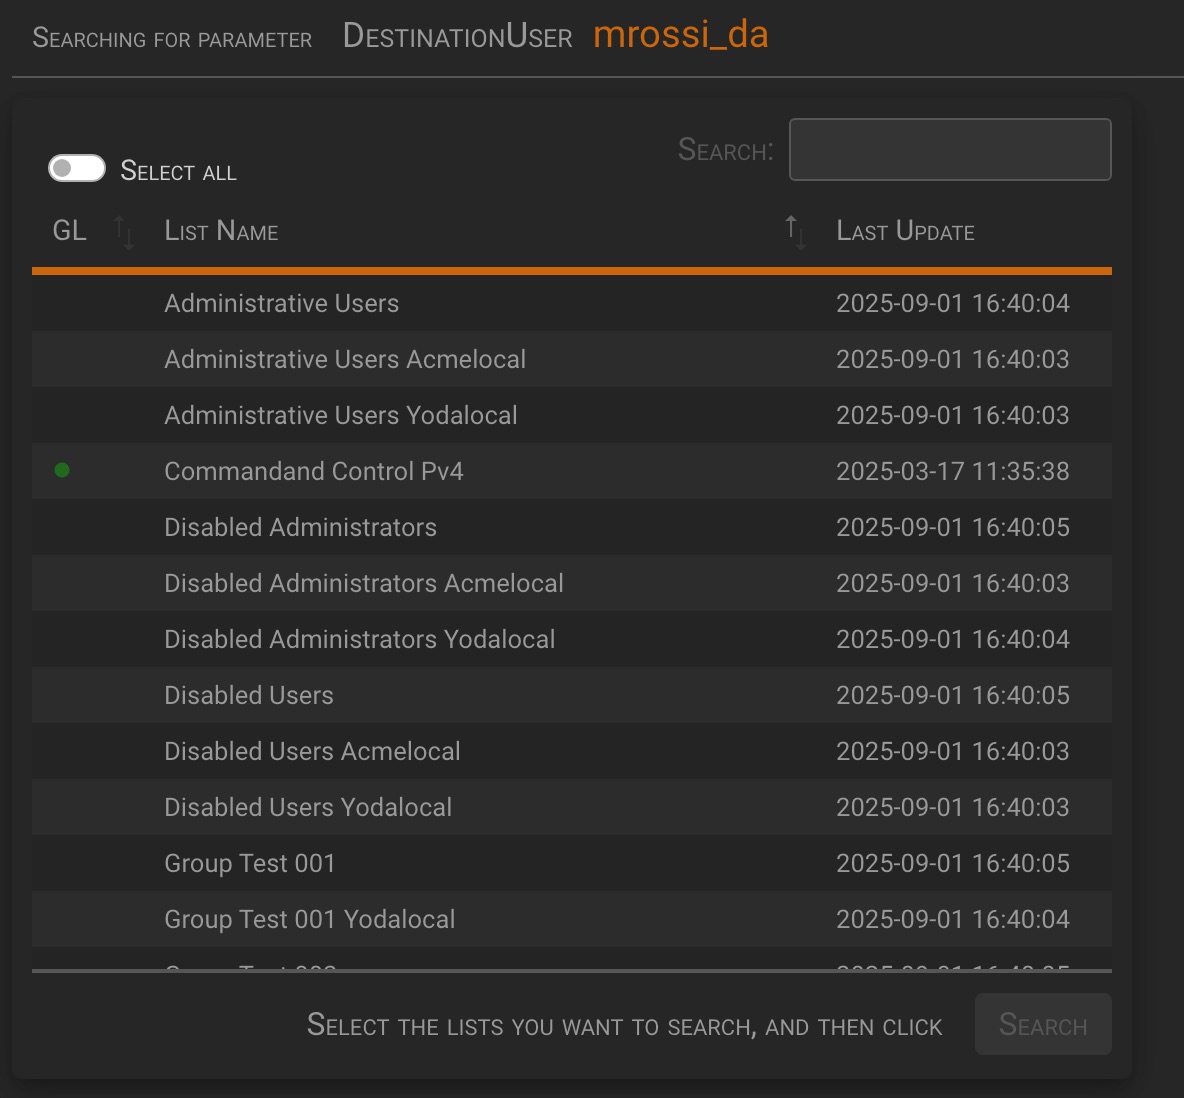
You can search all lists by selecting the Select All option, or you can select one or more lists individually by clicking on them. Click the Search button to start the search.
1.2.3 Send to Playbook
This action allows you to execute a Playbook and pass the selected parameter value as input to it.
TIP
When operating from the Manager Instance, a green dot in the GL column means that the Playbook is globally defined on the Manager. Other Playbooks are related to the tenant’s alarm.
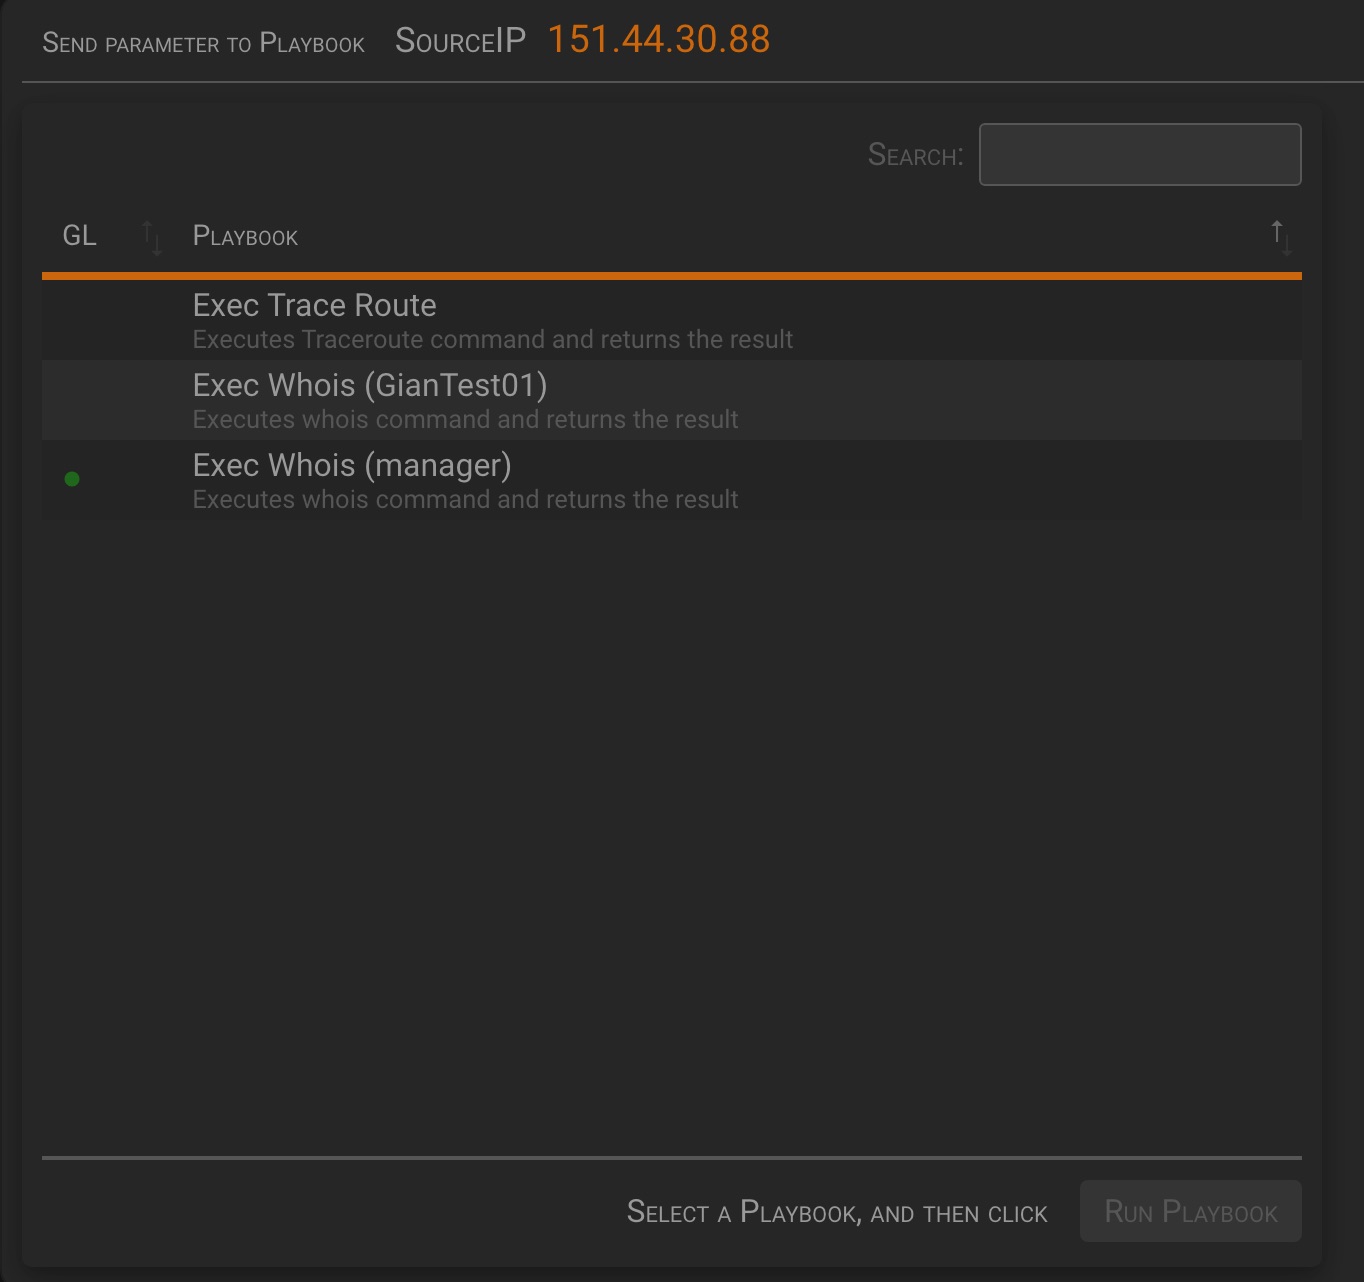
Select the Playbook you want to execute by clicking on it, ten click the Run Playbook button to execute it.
![[Alarm detail action playbook full.jpeg]
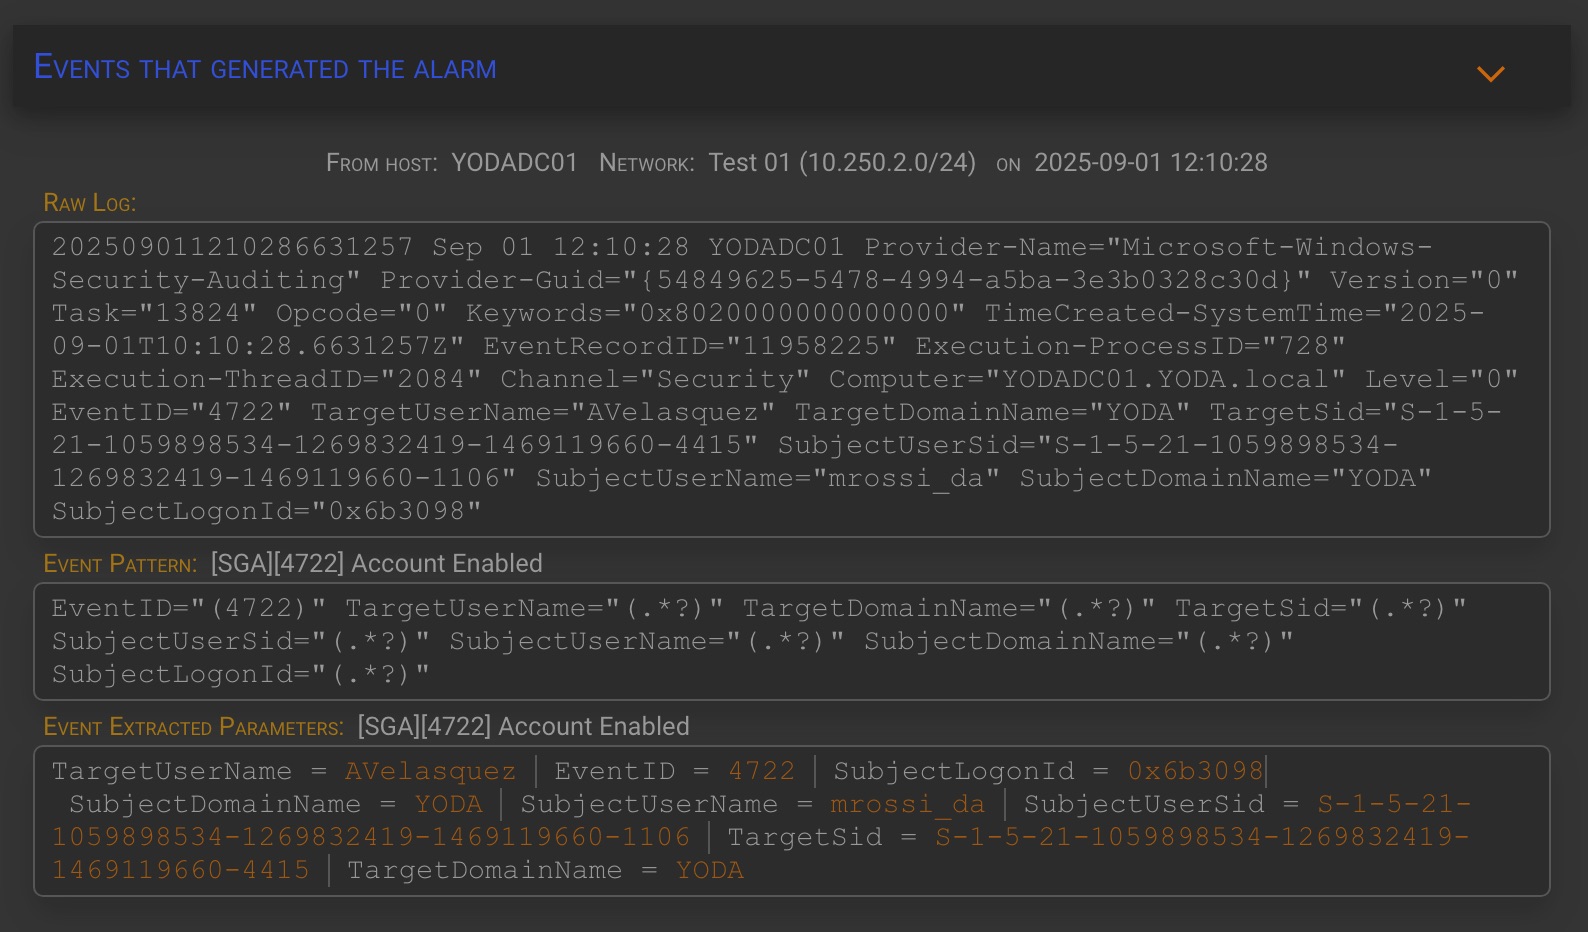
2 Events that generated the alarm
Clicking on the Events that generated the alarm tab will display the following details for each event that generated the alarm.
- The related raw log
- The pattern used to match the raw log
- The parameters extracted by the pattern
TIP
The information level and the maximum number of analyzed events can be set in the Configuration→Option panel setting the following options:
- Event details view level :
- Max Events to show in details view