1 The Historical Analysis
Historical analysis panels allow you to see how administrators, users, groups, and computers have changed over time.
Note
Historical analysis is based on the Active Directory’s Historical Data Collection, which must be enabled and configured properly in the Configuration Options panel.
How explained in the configuration panel help, enabling the Historical Data Collection will increase disk space usage.
The amount of space used depends on several factors, including the number of objects in the monitored Active Directories, how frequently snapshots are taken, and how long the history is retained.
Once Historical Data Collection is enabled, please wait a couple of collection cycles before expecting significant data on the panels.
2 How to use Historical analysis panels
All historical analysis panels work the same way.
Historical Analysis panels are split into four sections:
| Section | Description |
|---|---|
| 1 - Choose a Domain | Select the domain you want to analyze |
| 2 - Choose the objet to analyze | Select the object you want to analyze |
| 3 - Select the left and right snapshot to compare | Select the snapshot date you want to compare |
| 4 - Result | The snapshot compare result |
Once the AD domain is selected in Section 1, Section 2 will populate with a list of objects (administrators, users, groups, or computers) found in the selected AD domain. Selecting an object in Section 2 will populate Section 3 with all the available snapshot dates.
Selecting a left and a right snapshot date will populate Section 4 with the comparison result.
Important
Historical analysis is not a warning system due to its use of cold data, such as Active Directory snapshots. Its purpose is to analyze changes to objects over time. To receive alerts when an object changes, please install the “Windows Audit” package.
Now, let’s look at some examples.
2.1 Administrators
The administrators list is generated by the backend functions and refreshed hourly. By default the system will recursively load the users belonging to the Administrators group, but you can enrich the list by adding your own groups to the list (see Domain Configuration).
The Historical Analysis Administrators panel allows you to analyze changes to the administrators list over time.
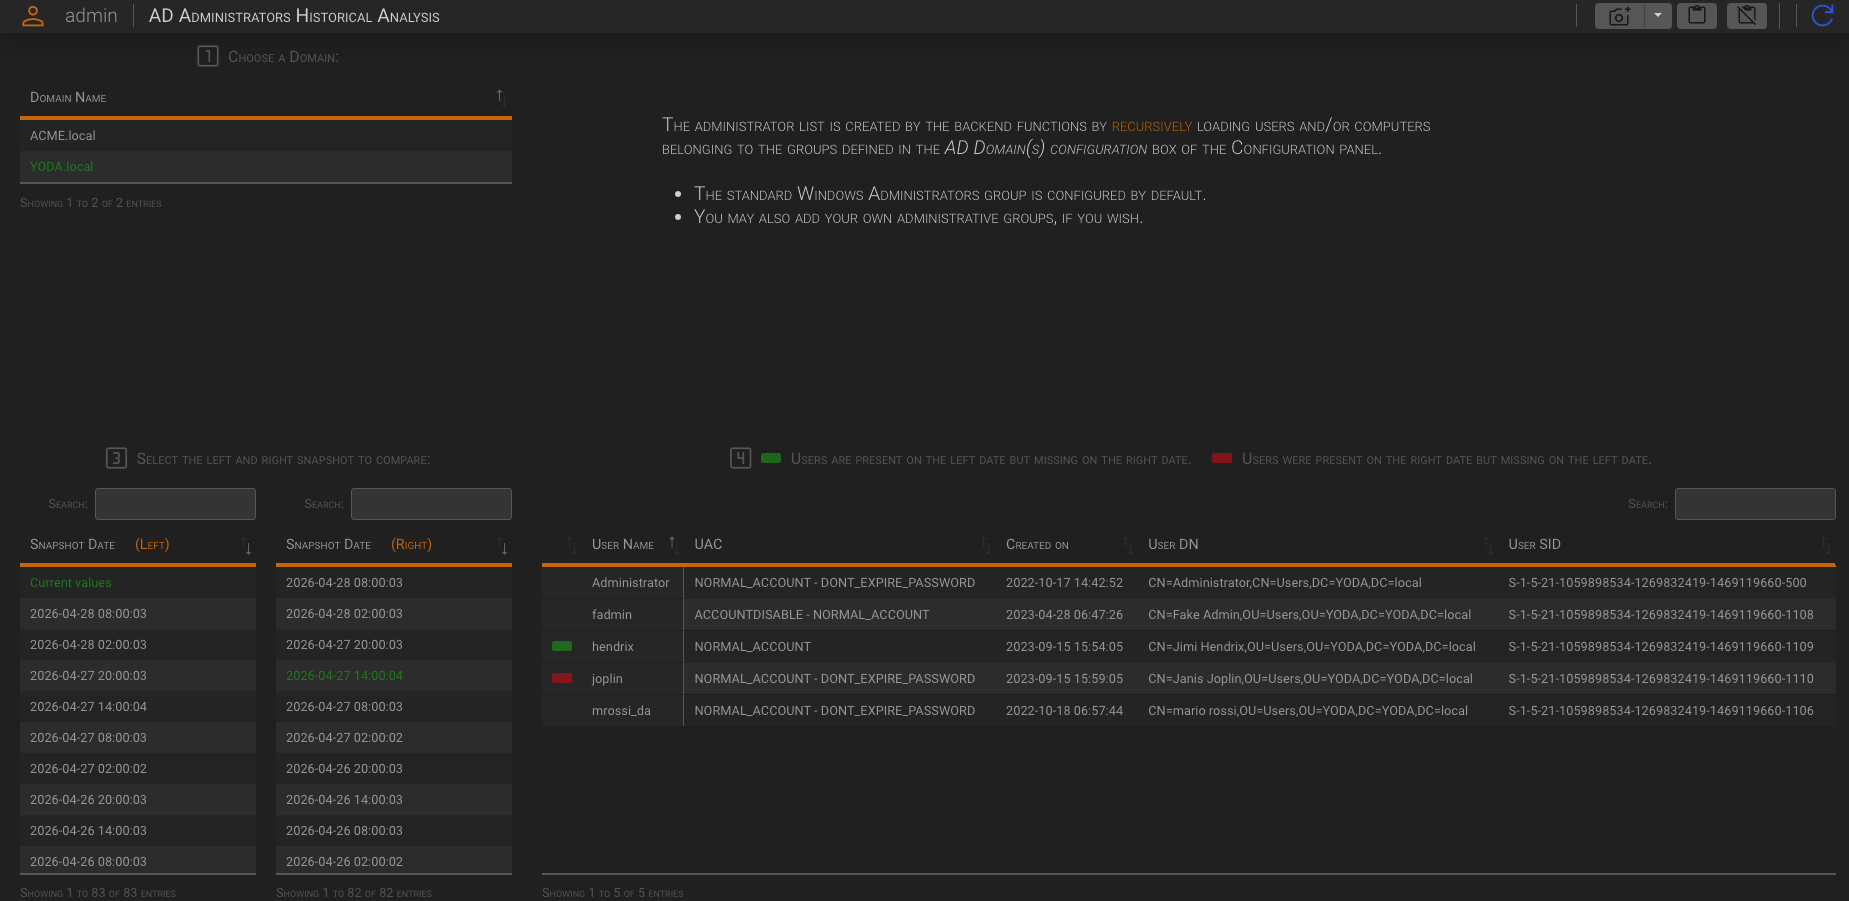
This example illustrate the Administrators analysis from the YODA.local domain. The current values (the values of the last collection) has been compared with the snapshot taken on 2026-04-27 at 14:00:04.
The comparison results show that user joplin was present in the Administrators list on 2026-04-27 at 14:00:04, but is not present in the current Administrators list. Meanwhile, user hendrix, who is present in the current Administrators list, was not present on 2026-04-27 at 14:00:04.
To see when this change occurred, we must advance through some of the snapshots (on the right) until the differences between the left and right snapshots disappear.
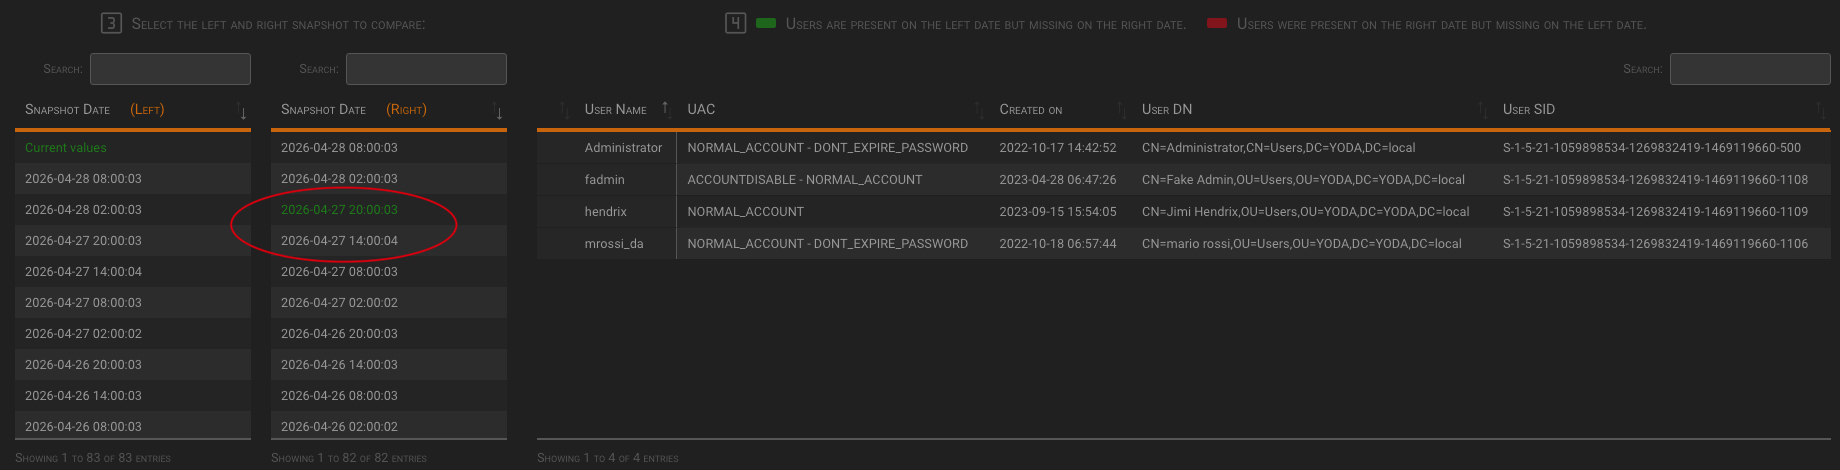
This indicates that the Hendrix user was added and the Joplin user was removed between 2:00 p.m. and 8:00 p.m. on April 27, 2026.
2.2 Users
The Historical Analysis Users panel allows you to analyze changes to users over time.
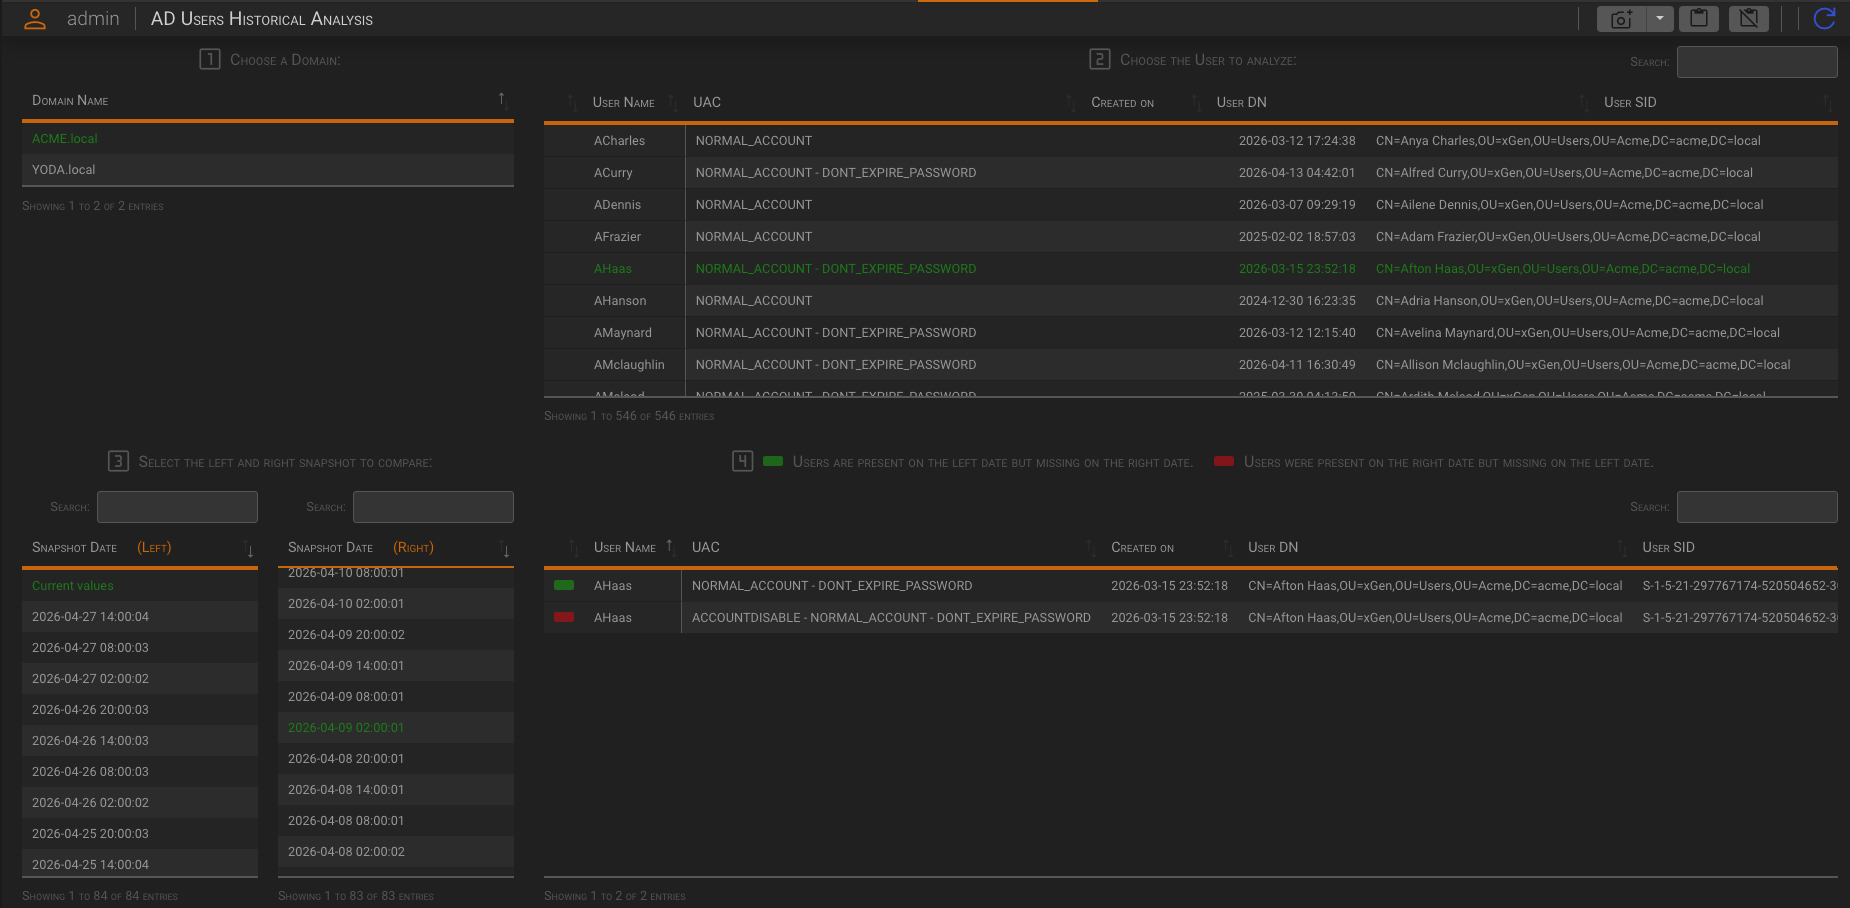
This example illustrate the analysis of the user AHaas, from the ACME.local domain. The current values (the values of the last collection) has been compared with the snapshot taken on 2026-04-09 at 02:00:01.
The comparison results show that the user account, that is currently “enabled”, on 2026-04-09 at 02:00:01 was “disabled.”
To see when the user has been disabled, we must go back through some of the snapshots (on the right) until the differences between the left and right snapshots disappear.
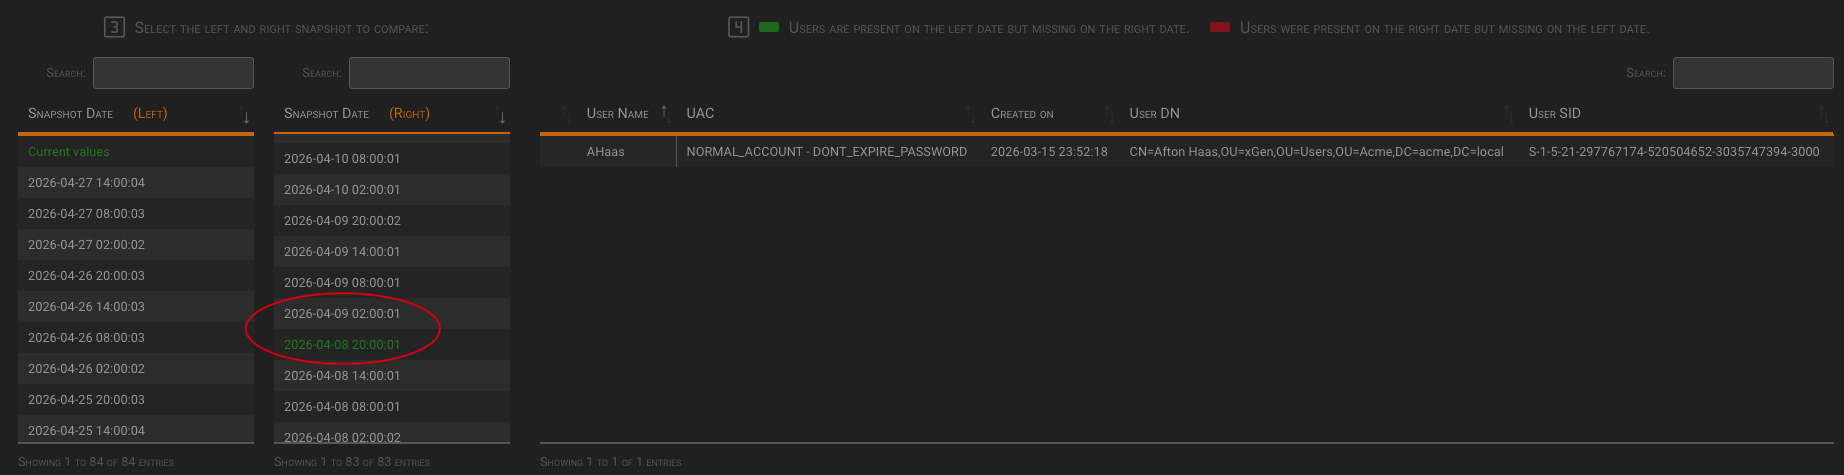
This indicates that the user was disabled at some point between 2026-04-08 at 20:00:01 and 2026-04-09 at 02:00:01.
To see when the user has been re-enabled, we must go forward through some of the snapshots (on the right) until the differences between the left and right snapshots disappear.
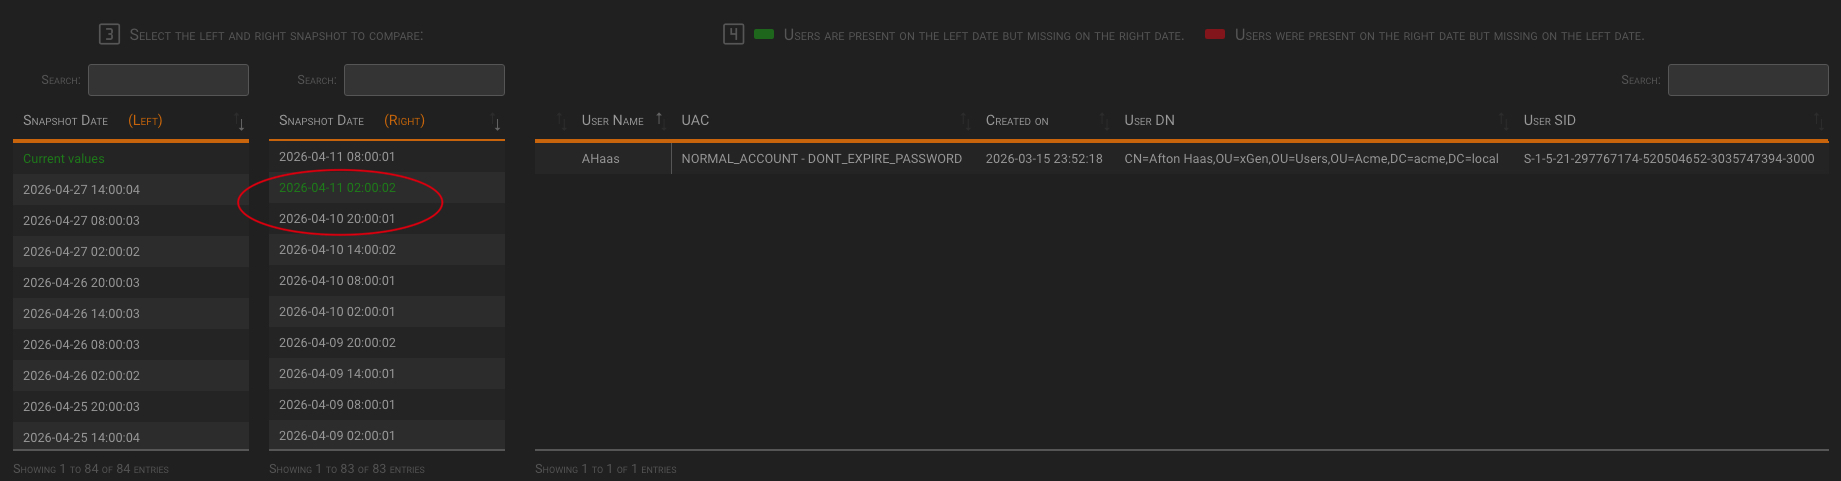
This means that the user has been re-enabled at some point between 2026-04-10 at 20:00:01 and 2026-04-11 at 02:00:02.
2.3 Groups
With the Historical Analysis Groups panel, you can analyze changes in group membership over time.
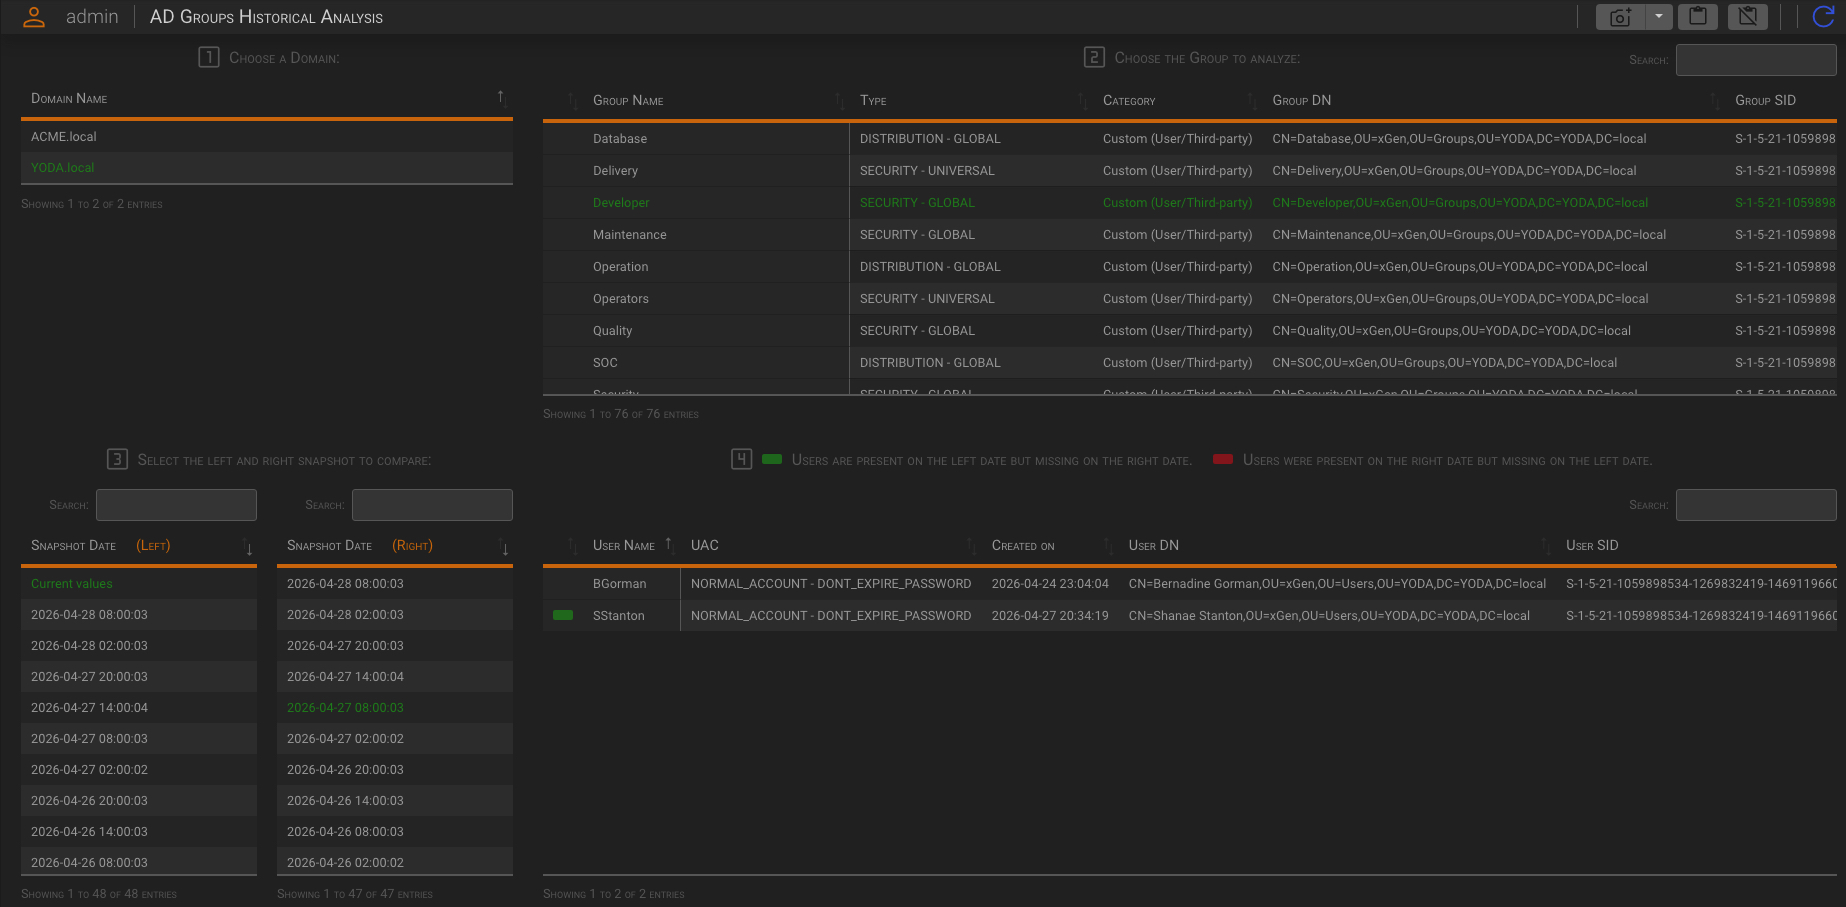
This example illustrate the analysis of the group Developer, from the YODA.local domain. The current values (the values of the last collection) has been compared with the snapshot taken on 2026-04-27 at 08:00:03.
The comparison results show that the user account SStanton present in the current values list, was not present in the snapshot taken on 2026-04-27 at 08:00:03.
To see when the user was added to the group, we must go forward through some of the snapshots (on the right) until the differences between the left and right snapshots disappear.
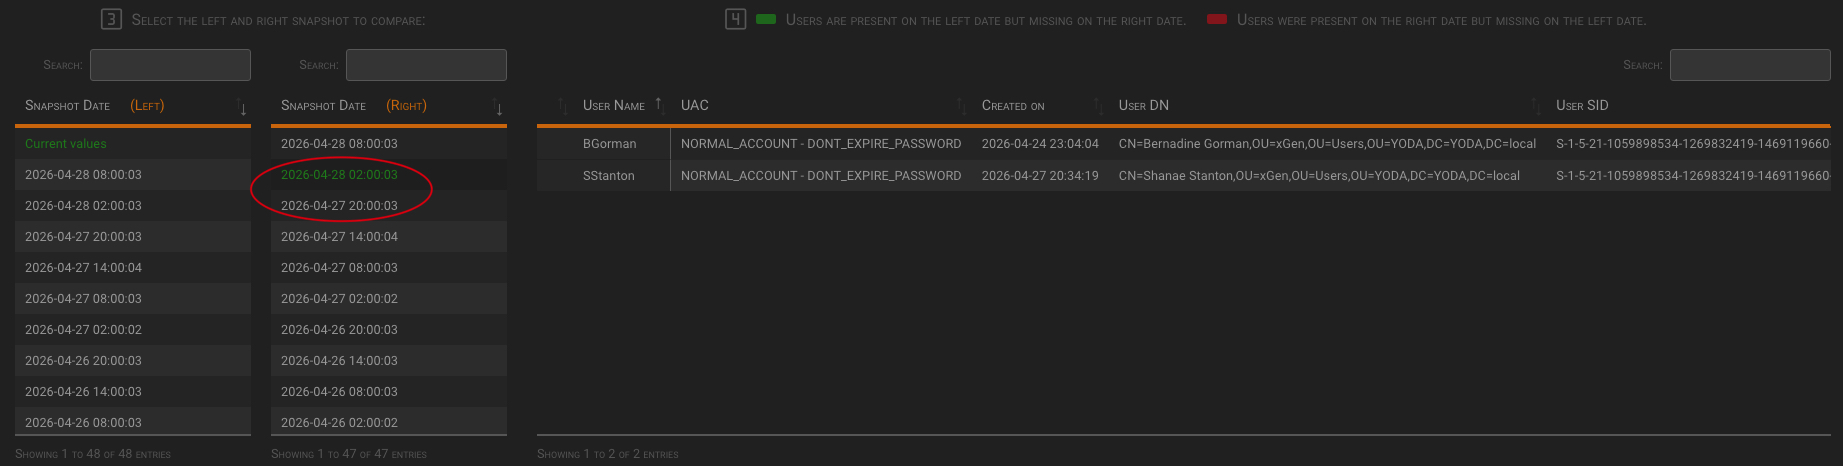
This means that the user was added at some point between 2026-04-27 20:00:03 and 2026-04-28 02:00:03.
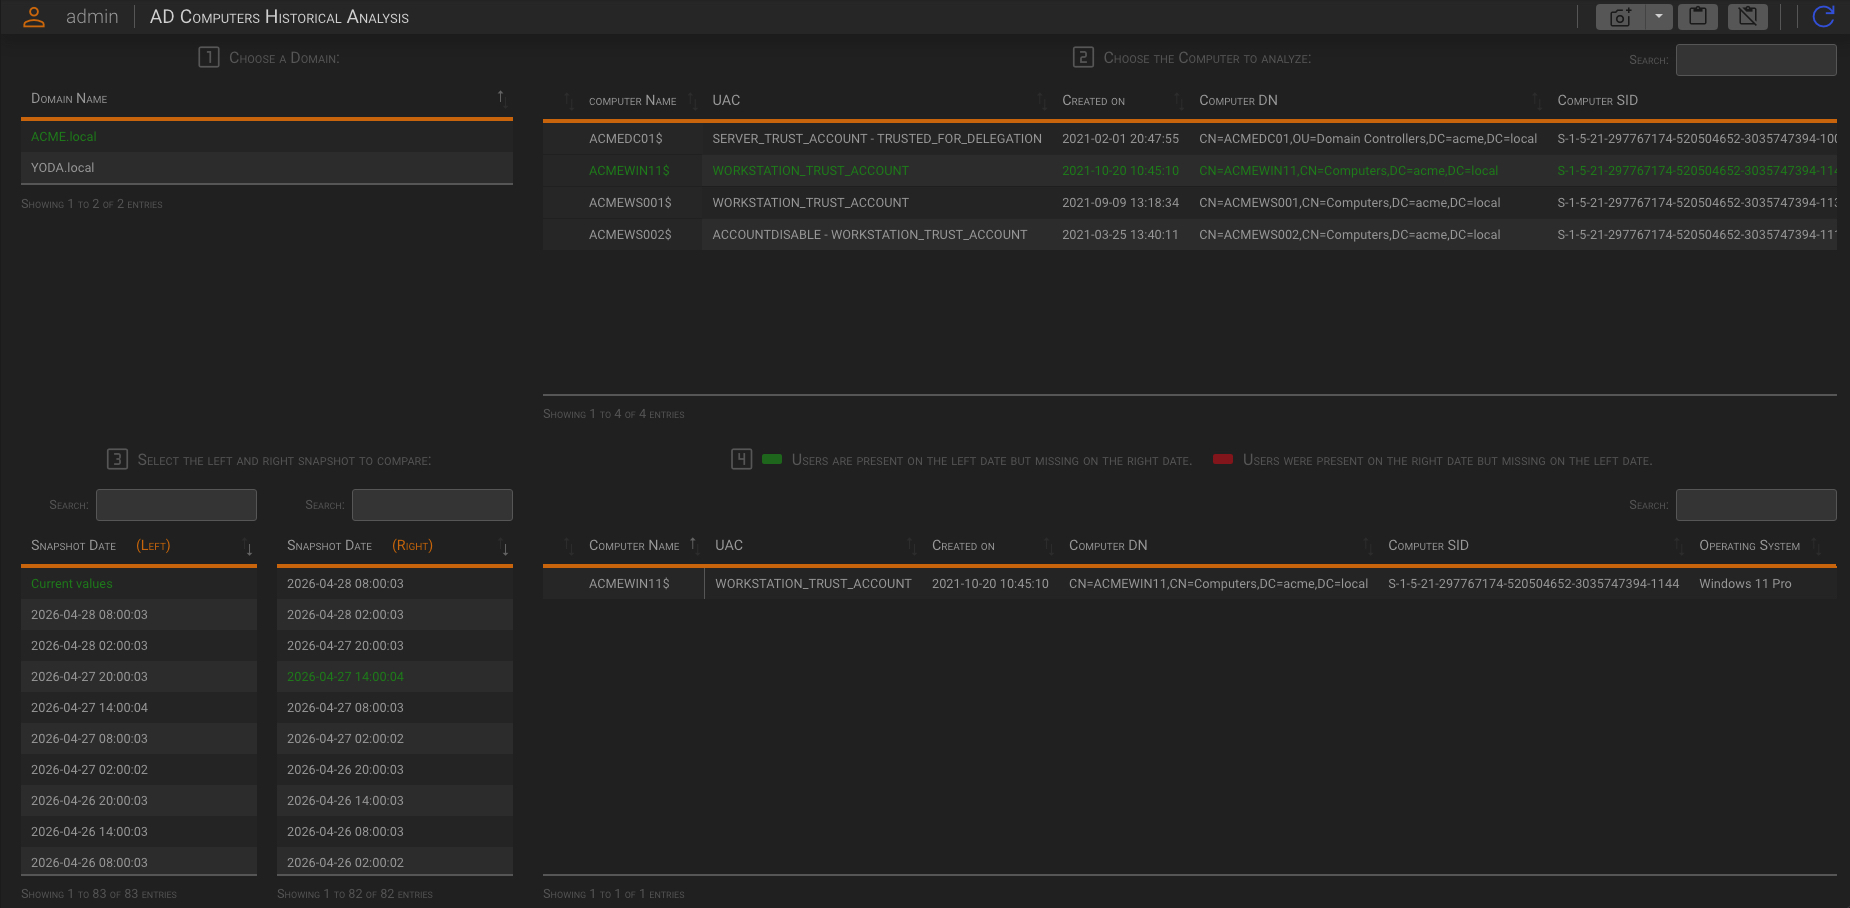
2.4 Computers
The Historical Analysis Computers panel allows you to analyze changes to computers over time.
Its analysis logic is the same of the Historical Analysis Users panel.