1 The Dashboard
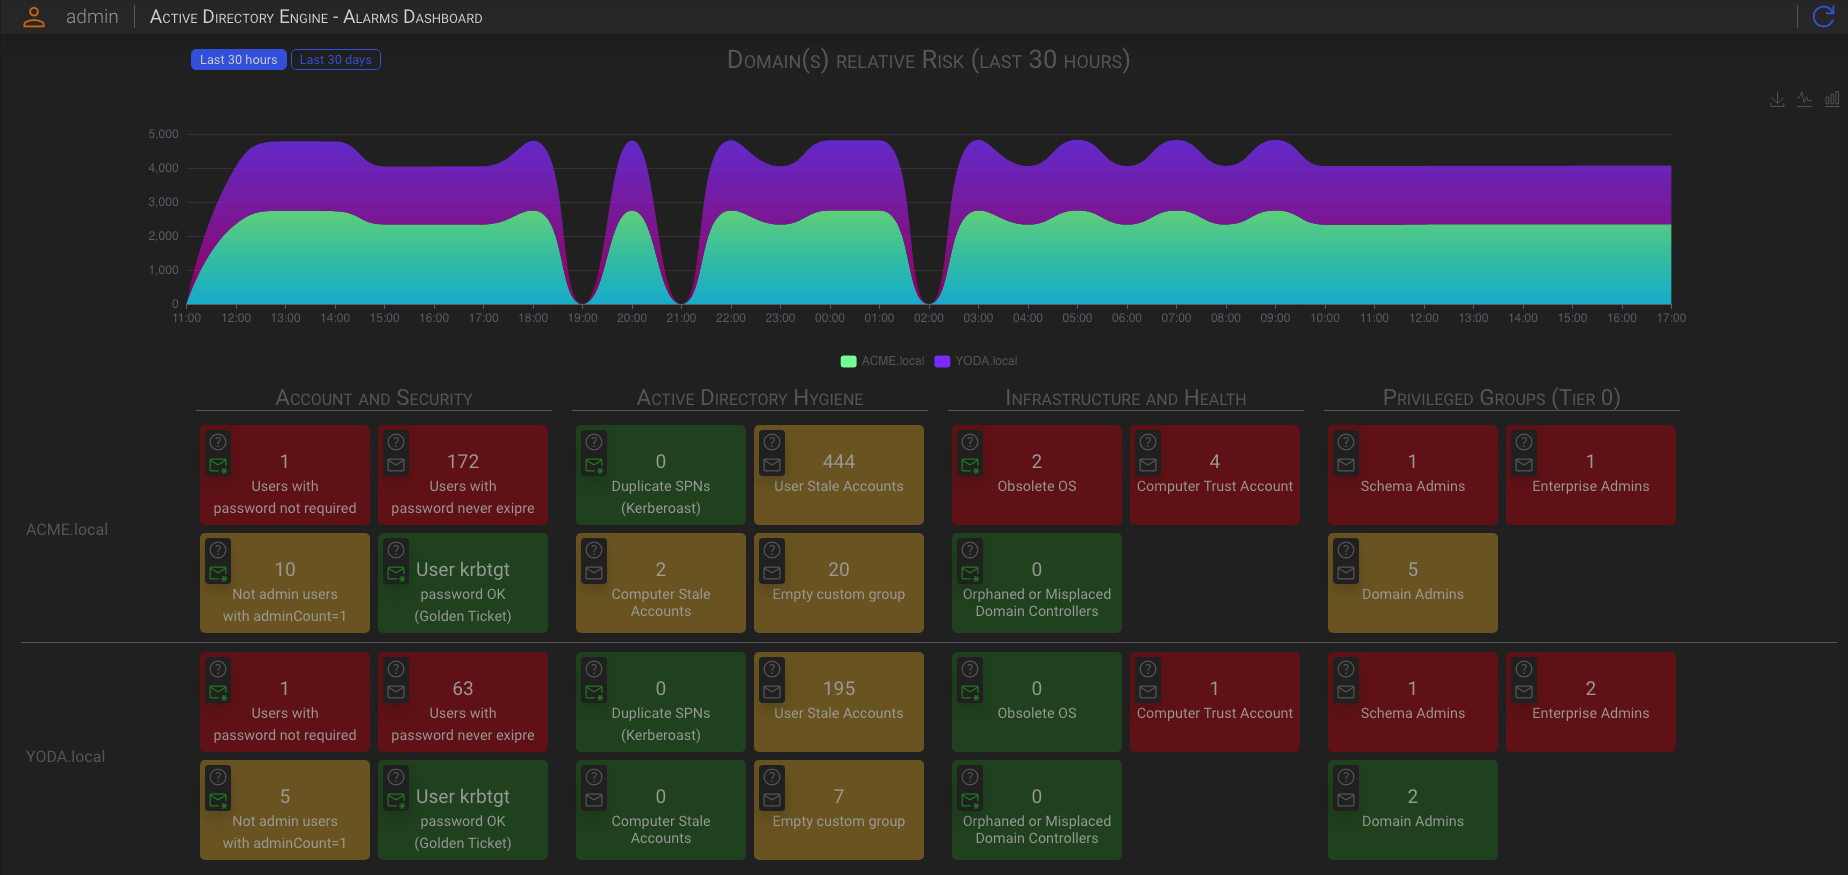
The ADE dashboard represent an overall health view of the monitored Active Directories.
1.1 The chart
The chart in the upper area shows the overall (relative) risk trend of your Active Directories
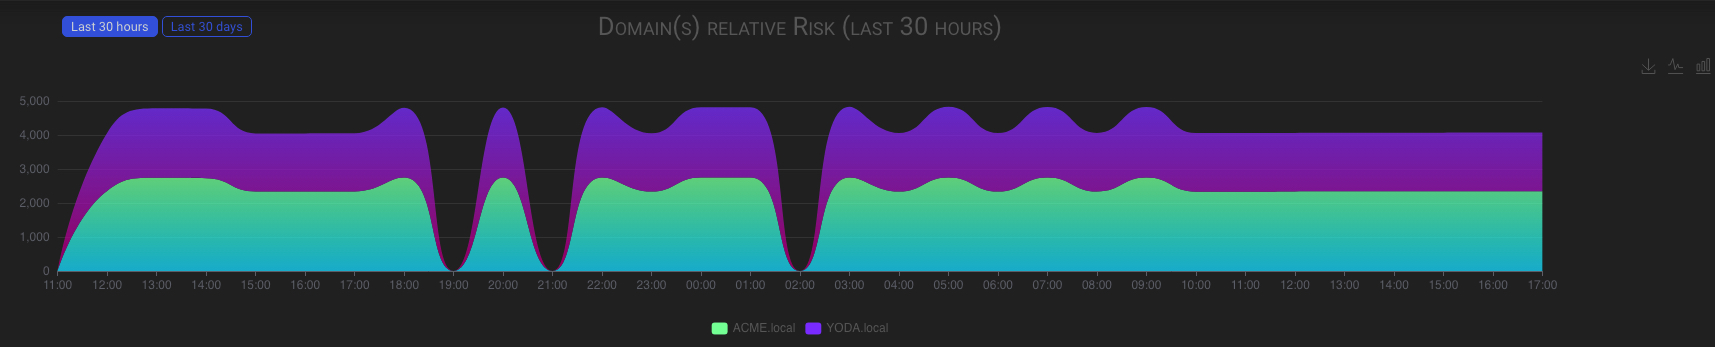
The AD Domain risk is determined by the backend, which analyzes two things: first, the discrepancy between the thresholds values you set in the Alarm Dashboards and the actual AD Domain values; and second, the deviation from the Microsoft active Directory best practice.
The analysis is conducted on an hourly basis following the data refresh.
1.2 The best practice matrix
The dashboard’s lower area contains a set of best practice violation indicators for each of the configured AD Domain.
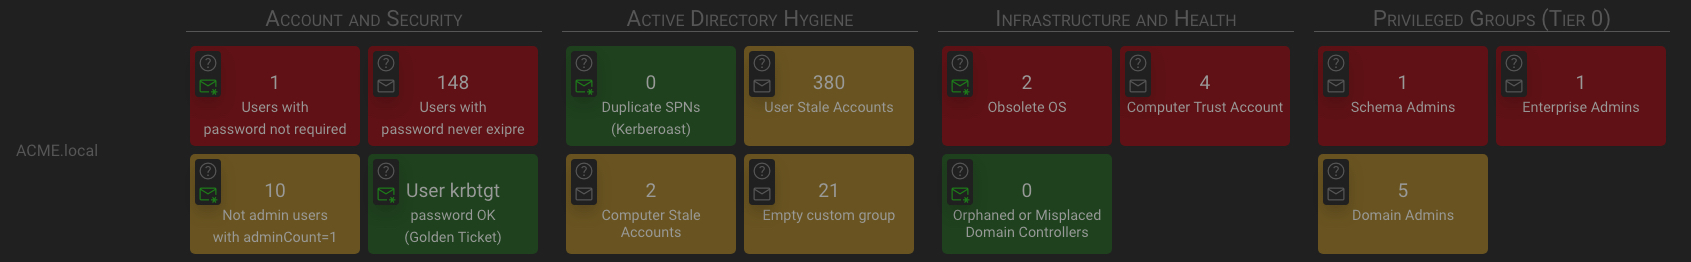
1.2.1 Best Practice Alerts
To toggle warnings about best practice violations, please click on the envelop icon in the top left corner of each box. The envelop icon will turn green when active.
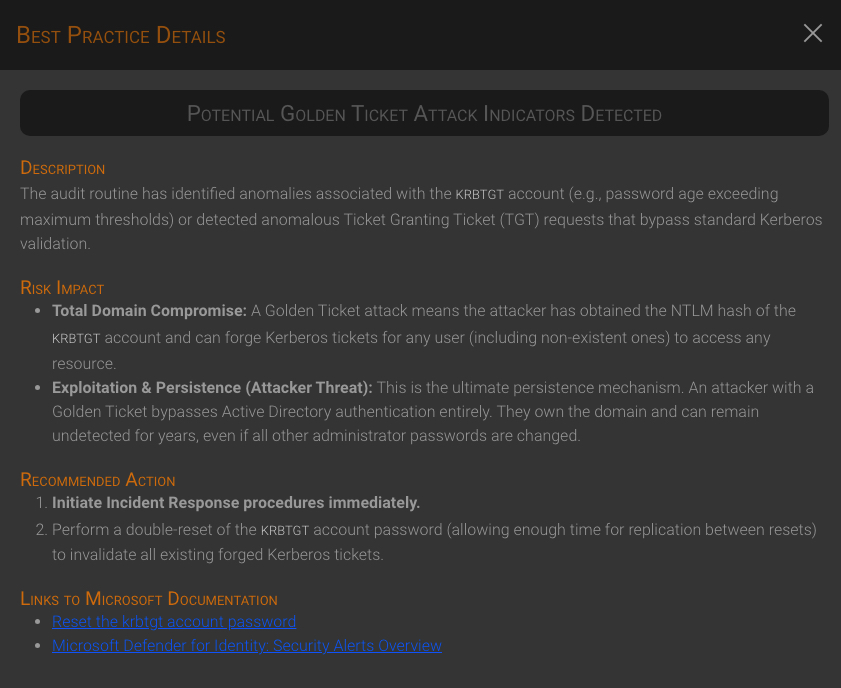
1.2.2 Best Practice Details
To get details on the best practice meaning, risk impact and recommended actions, click on the question mark icon in the top left corner of each box.